PopulationMid- 2012: 12,620,000
Density: 31 per sq. km. Rate of Natural Increase: 1.9% Growth rate: 1.9 Age < 15%: 43% Age 65+%: 4% Living Below U.S. $2 per day: -1 Undernourished: 47.0% Underweight Children Under 5: 17.00% HIV/AIDS among people 15-49: 14.3% |
Rate (# per 1000 People)Net Migration Rate: 0
Birth Rate: 34 Death Rate: 15 Infant Mortality Rate: 57.0 Total Fertility Rate: 4.1 Dependency Rate: 47% |
Life ExpectancyTotal: 46
Females: 45 Males: 46 |
MiscellaneousGNI PPP Per Capita in U.S. $: unavailable/ not collected
Mobile Phone Subscribers (Per 100): 17.00% Motor Vehicles (Per 1000): 54 |
Primary School Completion RateFemales: 80%
Males: 83% |
Secondary School Enrollment NetFemales: -1
Males: -1 |
Economically Active 15+Females: 60%
Males: 74% |
Population Pyramids
1995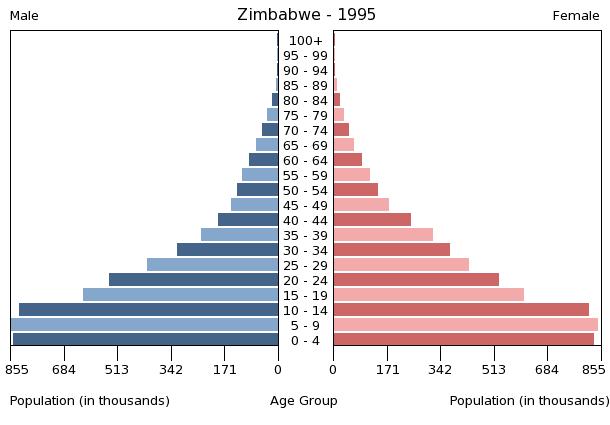
|
2010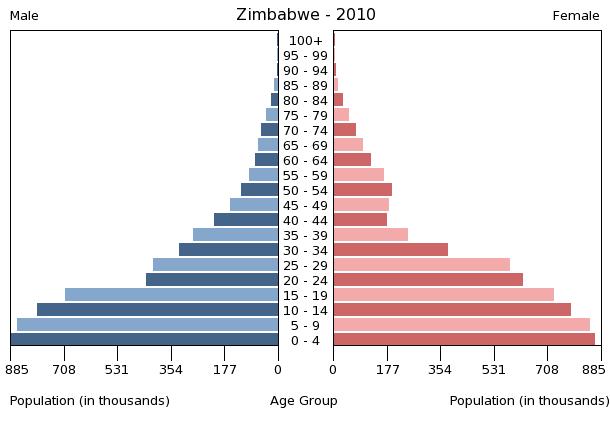
|
2025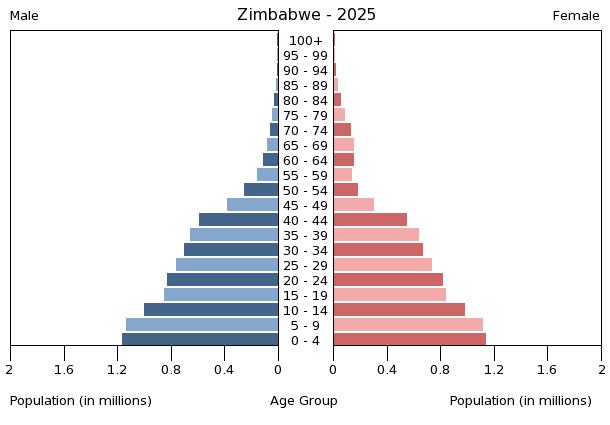
|
2050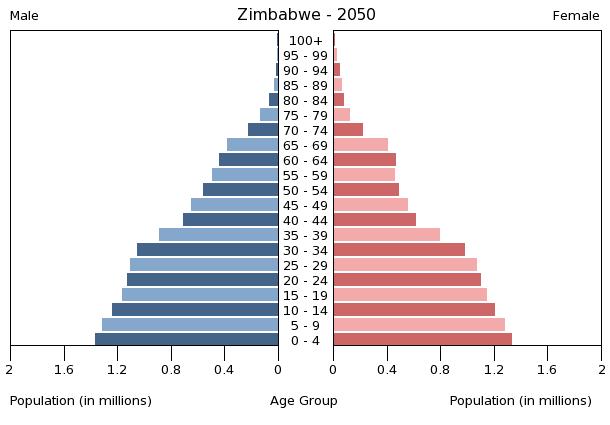
|
Demographic Transition Model
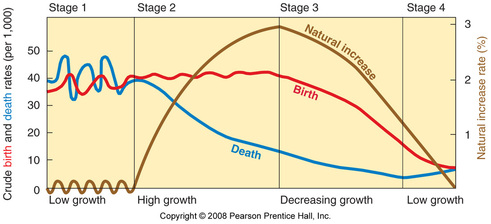
By applying the demographic transition model, I would assume that Zimbabwe would be included into stage one. Zimbabwe has a birth rate that is higher than the death rate. Zimbabwe has a high birth and death rate. Also, Zimbabwe has a low rate of natural increase. All these characteristics Zimbabwe has demonstrates that it belongs in stage one of the demographic transition model.
