PopulationMid- 2012: 2,049,000
Density: 34 per sq. km. Rate of Natural Increase: -0.5% Growth rate: -0.8 Age < 15%: 14% Age 65+%: 17% Living Below U.S. $2 per day: 1% Undernourished: 3.0% Underweight Children Under 5: -1 HIV/AIDS among people 15-49: 0.7% |
Rate (# per 1000 People)Net Migration Rate: -4
Birth Rate: 9 Death Rate: 14 Infant Mortality Rate: 5.7 Total Fertility Rate: 1.1 Dependency Rate: 31% |
Life ExpectancyTotal: 73
Females: 78 Males: 68 |
MiscellaneousGNI PPP Per Capita in U.S. $: $17,610
Mobile Phone Subscribers )Per 100): 99 Motor Vehicles (Per 1000): 376 |
Primary School Completion RateFemales: 93%
Males: 97% |
Secondary School Enrollment NetFemales: 85%
Males: 82% |
Economically Active 15+Females: 54%
Males: 70% |
Population Pyramids
1995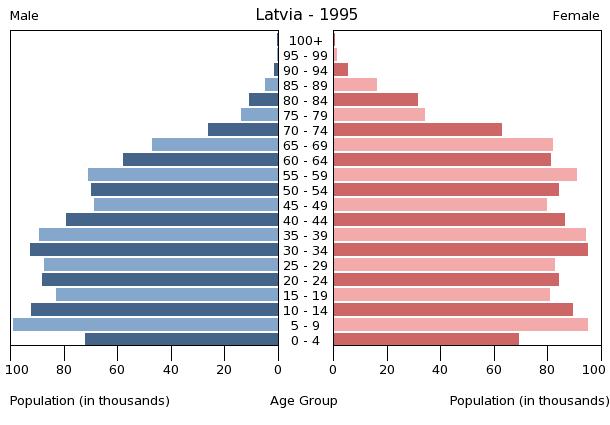
|
2010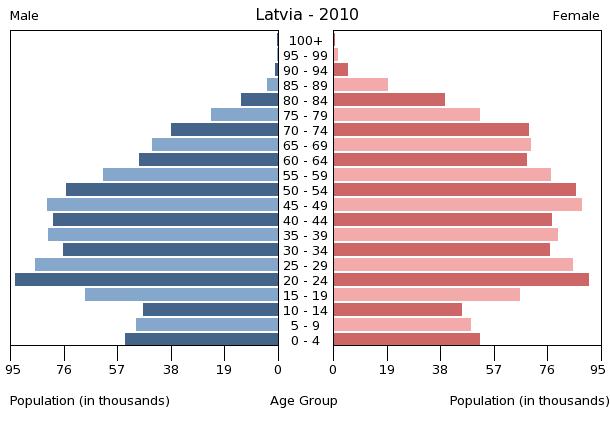
|
2025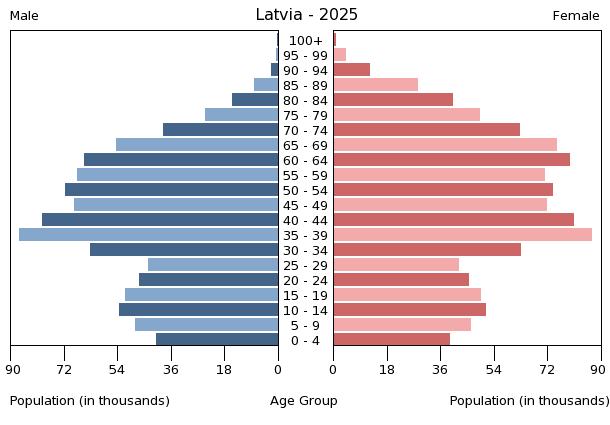
|
2050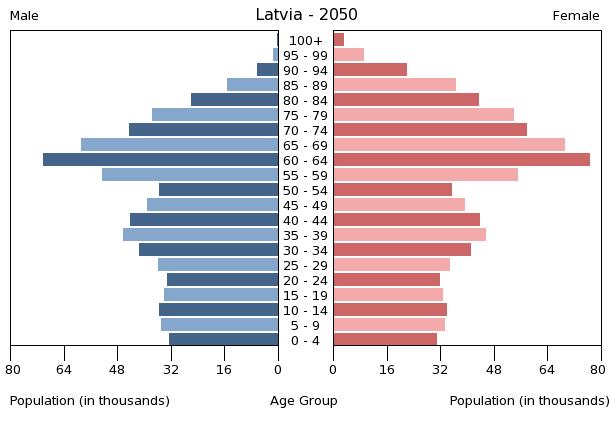
|
Demographic Transition Model
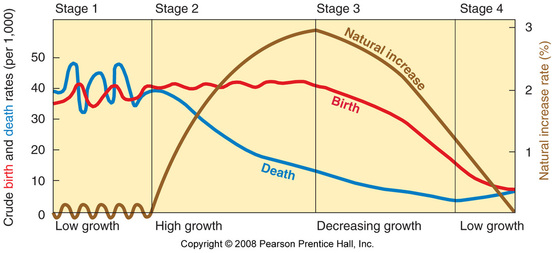
By applying the demographic transition model, I would assume that Latvia would be included into stage 5. Latvia has a birth rate that is lower than the death rate, which demonstrates a negative rate of natural increase. Also, Latvia has a total fertility rate that is lower than two. All these characteristics Latvia has demonstrates that it belongs in stage five of the demographic transition model.
